Legal & Trademark Notice
- Trademark Acknowledgment:CME®, Chicago Mercantile Exchange®, and QuikStrike® are registered trademarks of Chicago Mercantile Exchange Inc. and its licensors. All rights reserved.
- Non-Affiliation & Fair Use:This publication is an independent market commentary and educational analysis conducted under Fair Use doctrines (17 U.S. Code § 107). This content is neither sponsored, authorized, nor endorsed by CME Group Inc.
- Risk & Financial Disclaimer:Trading cryptocurrencies, futures, and options involves substantial financial risk and is not suitable for every investor. The analysis presented here represents personal research and educational opinion; it does not constitute financial advice, investment recommendations, or an offer to buy or sell any assets. Always conduct your own due diligence and consult a certified financial advisor before risking capital.
1. Introduction
Navigating Bitcoin’s broader market trends requires an analytical framework that connects price action with institutional positioning. While retail traders frequently rely on lagging technical indicators, institutional participants—including proprietary trading firms, asset managers, and liquidity providers—execute their risk management and positioning through regulated derivatives venues like the Chicago Mercantile Exchange (CME).
By integrating higher-timeframe Smart Money Concepts (SMC)—such as structural Inducements (IDM) and unmitigated Order Blocks (OB)—with institutional CME QuikStrike options data (Open Interest distribution, Greeks, and volatility modeling), traders can establish a systematic, high-probability market perspective. This article breaks down the current confluence between weekly price structure and institutional order flow.
2. Technical Analysis of CME Options Data
An evaluation of the CME Bitcoin options landscape reveals distinct institutional footprints:
A. Put/Call Ratio (PCR = 1.13)
- Total Put Open Interest: 619 contracts
- Total Call Open Interest: 549 contracts
- Market Bias: A Put/Call Open Interest ratio of 1.13 highlights that put positions outnumber call positions across the exchange. In institutional derivatives, an elevated put ratio near key horizontal demand zones typically signifies institutional put writing (cash-secured put accumulation) and structured hedging, establishing a robust downside price cushion.
B. Open Interest & Expiration Distribution
- Underlying Reference: The benchmark CME Bitcoin futures settlement price is established around $64,705.
- Front-Month Contract (30-Oct-26 / BTCV0): Represents the highest immediate liquidity concentration (~350 Calls vs. ~260 Puts), anchoring immediate frontline defense between $64,000 and $65,000.
- Second-Month (27-Nov-26 / BTCX0) & Quarterly (24-Dec-26 / BTCZ0): Put open interest substantially outpaces call open interest, anchored heavily at the $60,000 round strike (~75–80 contracts) and distributed across the $50,000 – $58,000 macro baseline.
C. The Greeks Profile (Delta, Gamma, Vega, Theta)
- Delta (Directional Sensitivity): Delta-adjusted matrices confirm active market maker delta hedging at $62,500–$64,000, with positive delta absorption building across the $58,000–$60,000 baseline.
- Gamma (Volatility Dampening): Prominent positive gamma clusters at $63,000 and $60,000 require option market makers to buy underlying futures on downward price dips to remain delta-neutral, creating an automatic volatility cushion.
- Vega (Implied Volatility Exposure): In the expanded 50-strike window, fresh institutional vega is heavily concentrated at $74,500 – $75,500 (+31,140 Vega), marking a primary upside volatility target and institutional hurdle.
- Theta (Time Decay Accumulation): Option writers have localized short-theta positioning around the $74,000–$75,500 zone (-171 to -400 Theta), representing levels where institutional sellers aim to capitalize on premium decay.
D. Vol2Vol™ Expected Range & Churn Metrics
- 1-Standard Deviation (1σ): On the weekly P16V6 (5.57 DTE) contract, the 1σ downside boundary lands precisely at $63,000 (aligned with the 25-Delta put marker).
- Churn Ratio: The Churn metric at $63,000 stands at 1.0 (100%), verifying that 100% of the traded put volume was absorbed as persistent, sticky open interest rather than intraday day-trading turnover.
- 2-Standard Deviation (2σ): Terminates at $60,000 (representing a 95% statistical probability boundary).
- 3-Standard Deviation (3σ): Anchors across $57,500 – $58,000 (99.7% tail-risk confidence boundary).
3. Top 3 Institutional Support & Resistance Levels
Combining CME QuikStrike derivatives data with our independent weekly technical structure establishes three definitive market zones:
Support Level 1: $63,000 – $64,000 (Immediate Frontline Buffer / 1σ Boundary)
- Data Confluence: Positioned directly beneath the current futures benchmark ($64,705). This level represents the 1-Standard Deviation expected move on short-dated contracts, backed by a 100% Churn rate at $63,000 and dynamic gamma cushioning.
- Technical Role: Serves as an initial short-term buffer. While minor intraday pullbacks can bounce here, higher-timeframe momentum may sweep this level to collect resting liquidity.
Support Level 2: $60,000 (Major Structural Support / The Mega Put Wall & Weekly OB)
- Data Confluence: This is the most critical support level on the entire board. In the CME strike profile, $60,000 hosts the single largest Put Open Interest tower (~75 to 80 contracts across expirations) and marks the 2-Standard Deviation (2σ) statistical boundary under the Vol2Vol™ model (95% confidence).
- Technical Role: Our technical analysis identifies this area as aligning directly with the unmitigated weekly Order Block (OB), making it a primary institutional confluence zone for a high-probability bullish reversal.
Support Level 3: $50,000 – $58,000 (Deep Macro Institutional Floor / 3σ Tail-Risk Base)
- Data Confluence: Supported by heavy put positioning in November and December quarterly contracts (BTCX0 and BTCZ0), with immediate clusters at $58,000 and an isolated long-term institutional volume spike at $50,000 (~45 contracts).
- Technical Role: Corresponds to the 3-Standard Deviation (3σ) tail-risk boundary (99.7% statistical safety net), serving as the ultimate macro accumulation floor in the event of an extended market correction.
4. Data Summary Table
| Level Classification | Price Zone | Relevant CME Options Data | Technical / Model Confluence | Institutional Market Role |
| Immediate Support (1σ) | $63,000 – $64,000 | Front-Month Put Cluster, 100% Churn Rate | 1σ Standard Deviation, 25-Delta Put, Gamma Buffer | Initial downside buffer; absorbs minor intraday retracements |
| Major Support (2σ) | $60,000 | Mega Put Wall (75–80 OI), Nov/Dec Put Anchor | 2σ Standard Deviation (95% Boundary), Weekly Order Block | Primary structural support; major institutional accumulation floor |
| Macro Floor (3σ) | $50,000 – $58,000 | Quarterly BTCZ0 Puts, $50k Strike Spike (~45 OI) | 3σ Tail-Risk Boundary (99.7%), Deep Vega Base | Ultimate macro safety net against systemic market liquidations |
| Key Resistance 1 | $68,000 – $70,000 | Front-Month Call Inflow, Upper Strike Base | Breakout Retest Level, Near-term Call Wall | Initial liquidity pool and first take-profit milestone |
| Key Resistance 2 | $74,500 – $75,500 | Fresh Vega Inflow (+31,140), Heavy Short Theta | Intermediate Structural Volatility Wall | Major institutional supply and options pinning target |
| Macro Resistance 3 | $80,000 – $82,000 | Peak Call OI Strikes, Massive Dollar Vega Nodes | Upper Distribution Ceiling, Significant Supply | Primary long-term target and institutional expansion cap |
5. My Technical Outlook & Trading Strategy
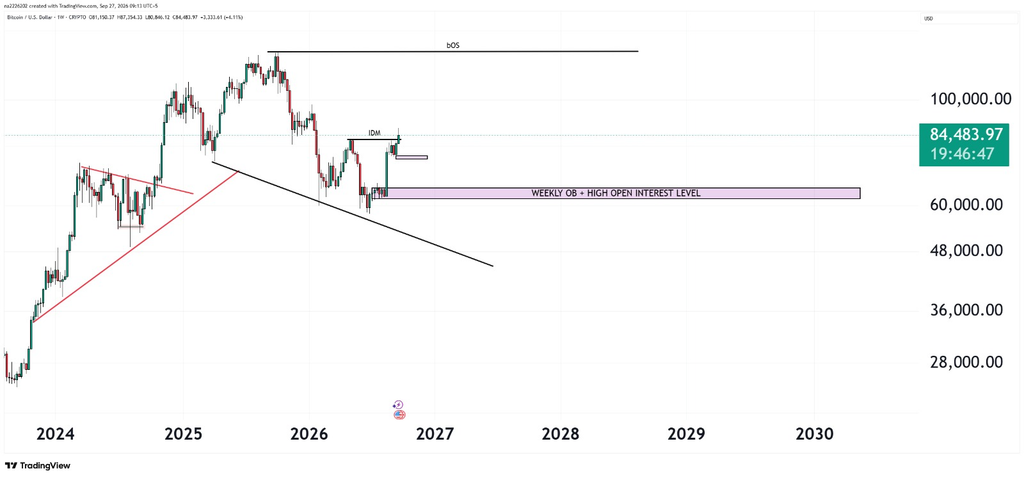
When analyzing Bitcoin’s macro price action, the weekly timeframe remains our most reliable perspective. Currently, Bitcoin is demonstrating a robust and powerful uptrend across all timeframes. However, markets do not move in straight lines; for the price behavior to normalize and sustain its long-term growth, a healthy bearish correction is necessary.
The Technical Catalyst: Weekly IDM Break
Looking closely at the weekly chart, Bitcoin has recently taken out the Inducement (IDM) level. From a technical standpoint, this structural shift significantly increases the probability of a short-term bearish pullback. The market needs to retrace to collect trapped liquidity before it can fuel the next major leg up.
The Target: Weekly Order Block and CME Confluence
The logical target for this anticipated bearish drop is the unmitigated weekly Order Block (OB). What makes this specific support zone exceptionally strong is its alignment with key CME (Chicago Mercantile Exchange) data points. The confluence of a weekly Order Block with CME levels creates a massive zone of interest. Once the price taps into this precise area, the probability of a strong bullish reversal is extremely high.
A Warning for Traders: Respect the Higher Timeframe
To capitalize on this upcoming move, patience is absolutely critical. Traders must wait for the price to drop into this weekly macro level before executing trades.
It is important to remember that because this IDM break occurred on the weekly timeframe, the resulting downward momentum will be dominant. During this drop, the market will likely ignore and slice through minor Order Blocks on lower timeframes. Relying on smaller timeframes right now could trap you in premature trades.
The Bottom Line
Do not rush the market. Wait patiently for Bitcoin to reach the weekly Order Block confluence zone. Letting the price come to this premium area will offer you a high-probability, low-risk trading opportunity with excellent reward potential.
6. Frequently Asked Questions (FAQ)
What makes the $60,000 level a “Mega Put Wall”?
In options markets, a “Put Wall” refers to the strike price with the highest concentration of open put contracts. At $60,000, institutional participants have accumulated between 75 and 80 contracts across maturities. Option sellers defend this level through dynamic delta hedging, making it a powerful barrier against sustained downside continuation.
How does a weekly Inducement (IDM) break affect lower-timeframe setups?
An Inducement break on a macro timeframe signals that the market is seeking liquidity deeper in the range. Lower-timeframe (15-minute or 1-hour) demand zones often fail during higher-timeframe corrective legs because macro momentum overrides minor order flow. Traders are advised to prioritize higher-timeframe Order Blocks for trade execution.
Why is the Put/Call Ratio of 1.13 considered constructive?
While high put volume can reflect retail hedging, an open interest Put/Call Ratio above 1.0 in institutional environments often indicates that market makers have written substantial downside puts. This creates a positive gamma floor, meaning institutions actively support price on dips.
7. Conclusion
A disciplined trading approach demands the alignment of higher-timeframe market structure with verifiable institutional derivatives data. As highlighted by the CME QuikStrike options landscape, Bitcoin benefits from layered institutional defense: an immediate volatility boundary at $63,000, a major structural foundation at the $60,000 Mega Put Wall, and an ultimate macro floor across $50,000 – $58,000.
With the weekly Inducement (IDM) broken, patience remains paramount. Awaiting a measured retracement into the confluence of the unmitigated weekly Order Block and the CME $60,000 support zone provides a disciplined, data-backed setup to capitalize on Bitcoin’s next major macro expansion.
Leave a Reply