Tag: Blockchain

  • EUR/USD Forecast: Combining Smart Money Concepts (SMC) & CME Options Data for High-Probability Trade Setups


    Disclaimer

    This article analyzes market positioning using data derived from the CME Group QuikStrike Tool strictly for educational, informational, and analytical commentary under the doctrine of Fair Use. The content presented herein is Not Financial Advice, investment guidance, or a solicitation to buy or sell any currency or derivative contract. Foreign exchange and futures trading involve significant financial risk and may not be suitable for all investors. Always exercise prudent risk management and consult a licensed financial advisor before risking capital.


    Introduction

    Navigating the foreign exchange markets successfully requires peering behind the curtain of retail chart patterns into the realm of institutional order flow. While retail technical analysis often focuses purely on lagging indicators, professional market participants track institutional commitments, liquidity sweeps, and options positioning.

    For the EUR/USD (6E) currency pair, combining Smart Money Concepts (SMC) with institutional derivatives analytics creates an exceptionally powerful trading edge. While price action reveals where liquidity resides on the price chart, exchange options metrics—such as Open Interest, Delta-hedging obligations, Gamma clusters, and Vega risk—reveal where market makers and large institutions are financially committed to defending the market.

    This publication breaks down the latest CME Group options positioning, establishes the critical institutional support and resistance boundaries, and outlines a multi-timeframe SMC execution strategy.


    Technical Analysis of Options Data

    A thorough examination of the currency options chain across multiple metrics (Open Interest, Volume, Delta, Gamma, Vega, Theta, and Churn) provides an empirical map of institutional positioning:

    1. Volume Put/Call Imbalance (P/C Ratio: 1.97):
    • Total Put Volume reached 19,748 contracts, compared to 10,022 Call contracts, yielding an institutional Put/Call volume ratio of 1.97.
    • Traded put activity was virtually double that of calls. In exchange-traded currency options, heavy put trading combined with positive open interest growth indicates aggressive institutional put writing (selling downside protection to capture decay) rather than speculative buying.
    1. Open Interest (OI) & Structural Put Walls:
    • Total Put Open Interest stands at 230,499 contracts versus 220,809 Call contracts (OI P/C ratio of 1.04).
    • Put open interest is densely concentrated directly beneath current market pricing (1.1409 – 1.1436), creating a thick floor of institutional bids.
    1. Delta Exposure & Market Maker Hedging:
    • Delta-weighted Open Interest (OI × Delta) reveals massive negative delta exposure centered at key put strikes.
    • To maintain delta neutrality, options market makers must dynamically buy underlying futures contracts as prices approach these levels, creating automated buying support (Dealer Long Delta / Short Gamma absorption).
    1. Gamma Clustering (GEX) & Volatility Suppression:
    • The monthly contract exhibits a peak Gamma concentration of over 232,000 Gamma, centered at the At-The-Money (ATM) boundary.
    • High positive dealer gamma suppresses volatility, turning these strike zones into market magnets and strong structural floors.
    1. Vega Exposure & Long-Dated Institutional Hedging:
    • Longer-dated expirations (17 DTE to 40 DTE) show substantial Put Vega accumulation, indicating that large institutions have parked their macro downside insurance at deep structural base levels.
    1. Institutional Churn Rate (Conviction Metric):
    • Analysis of the Churn ratio reveals retention rates as high as 95% on primary defensive strikes. This confirms that traded volume was not day-trading noise, but permanent, high-conviction institutional positions held overnight.

    Top 3 Support/Resistance Points

    Based on institutional order flow, gamma clustering, and open interest distribution, the key levels defining market structure are:

    1. Immediate Active Support: 1.1425

    • Supporting Data:
    • ~1,000+ Traded Gamma per Pip across short and intermediate weekly contracts.
    • +1,210 contracts added in the near-term 3-DTE expiry (WE2V0).
    • Churn retention rate of 75%–80%, reflecting high institutional holding.
    • Reasoning: Situated just 11–14 pips below current market pricing (1.14365 reference / 1.1409 futures), this is the front line of defense. Market makers have accumulated substantial short-dated gamma here, ensuring rapid dynamic buying response on any initial intraday dip.

    2. Primary Institutional Wall (The Core Anchor): 1.1400

    • Supporting Data:
    • 10,770 Put contracts in the monthly expiration (EUUV0) alone.
    • -5,012 Delta Exposure—the largest single delta concentration across the entire options chain.
    • 232,000+ Put Gamma peak node.
    • Reasoning: 1.1400 is the central institutional battleground. Because of the sheer magnitude of delta and gamma exposure, options market makers are forced to aggressively hedge and absorb sell orders at this boundary. It functions as the primary macro support floor for the entire cycle.

    3. Shock-Absorber Defense: 1.1375

    • Supporting Data:
    • Single largest 1-DTE volume and OI spike: 1,510 traded contracts and +1,429 fresh puts added.
    • 95% Churn Rate (the highest conviction retention on the board).
    • 64,400+ 1-DTE Gamma with steep Implied Volatility (IV) smile skew.
    • Reasoning: In the event of a temporary liquidity sweep below 1.1400, 1.1375 acts as a fortress. Option writers who wrote over 1,400 contracts expiring in under 24 hours have maximum financial incentive to prevent this level from being breached, making it a prime institutional bounce zone.

    (Note: Major macro structural base support remains firmly anchored between 1.1300 and 1.1250, supported by over 4,000 traded volume contracts and long-dated 40-DTE vega accumulation).

    Key Overhead Resistance (Call Walls):

    • 1.1450 & 1.1500: Highlighted by massive Call concentrations (11,295 Calls at 1.1450 and 10,039 Calls at 1.1500), marking the upper ceiling of the current expected trading corridor.

    Data Summary Table

    The table below summarizes the quantitative derivatives metrics extracted across the options chain:

    Strike PricePrimary Metric / VolumeDelta / Gamma ProfilePosition TypeInstitutional Role & Market Impact
    1.1450 – 1.150011,295 & 10,039 CallsPeak Call Gamma & VolumeMajor Overhead ResistancePrimary overhead ceiling; heavy call writing caps short-term upside expansion.
    1.14251,210 Vol / 1,740 OI~1,000 Gamma/Pip (75% Churn)Immediate Active SupportFirst-line dynamic buffer; activates rapid dealer hedging on intraday pullbacks.
    1.140010,770 Monthly Put OI-5,012 Delta / 232k GammaPrimary Institutional WallCentral market anchor; high-density delta absorption floor preventing structural breakdown.
    1.13751,510 Vol / +1,429 OI Change95% Churn / 64.4k 1-DTE GammaShock-Absorber CushionHigh-velocity bounce zone; short-term options writers aggressively defend premium decay.
    1.1300 – 1.12503,600+ Put OI / 4,000+ Vol Spike170+ Longer-Dated (40 DTE) VegaMacro Structural BaseDeep institutional safety net; heavy macro hedging base floor for multi-week trend integrity.

    My Technical Outlook & Trading Strategy
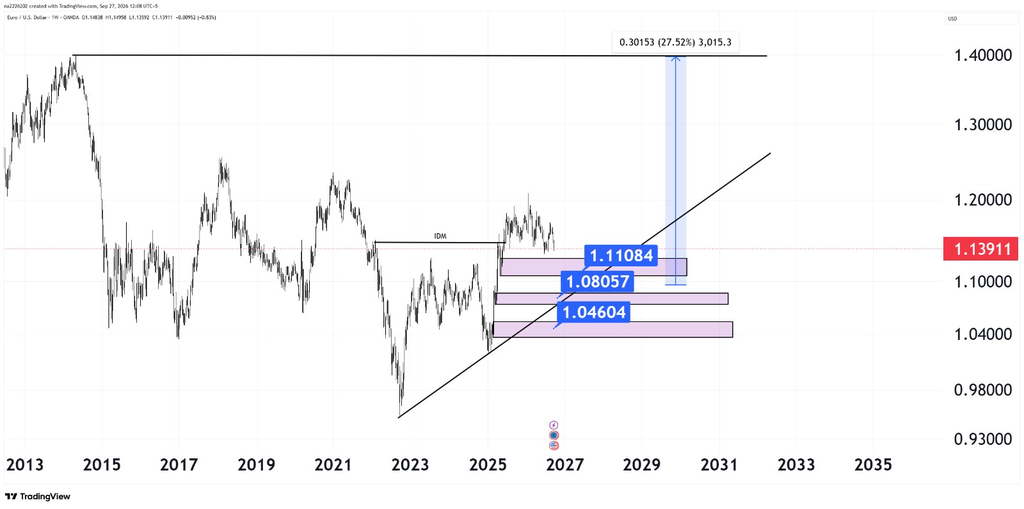
    1. Higher-Timeframe Structure: The Weekly Bullish Trend

    A top-down analysis begins on the weekly timeframe, which provides the macro narrative and prevailing order flow:

    • Market Behavior: The weekly trend remains clearly oriented to the upside, displaying consistent higher highs and higher lows.
    • Ascending Trendline Confluence: A well-defined ascending trendline underpins this price action, providing visual confirmation of sustained buying interest across multiple weekly cycles.

    Trading in alignment with this higher-timeframe trend significantly tilts the probability in favor of long positions, provided entry execution is handled with precision.

    2. Smart Money Concepts (SMC): Inducement & Key Demand Zones

    • Inducement (IDM) Formed: Under the SMC framework, liquidity drives price movement. Price has recently created and swept Inducement (IDM) on the higher timeframe. Taking out internal liquidity (IDM) signals that smart money has cleared temporary retail liquidity to fuel the next major expansion leg. The broader target remains the creation of a new swing high.
    • The Three Institutional Order Blocks (OBs): Beneath current market pricing lie three distinct Weekly Order Blocks (Demand Zones). These zones serve as institutional “fuel tanks”—areas where substantial buy liquidity resides to propel price back into the prevailing uptrend.

    3. Precision Entry Strategy: 1-Hour & 15-Minute Confirmation

    One of the most critical principles of professional trading is never entering blindly simply because price touches a higher-timeframe order block:

    • Do Not Front-Run: Limit orders placed directly at higher-timeframe order blocks expose traders to severe drawdown if momentum cuts through the zone.
    • Step-Down Process: Once price mitigates a weekly order block, switch immediately to lower timeframes—specifically the 1-Hour (1H) and 15-Minute (15M) charts.
    • Waiting for Lower-Timeframe Inducement: Look for market structure shifts on the lower timeframe, including:
    • A lower-timeframe Change of Character (CHoCH).
    • A clear sweep of lower-timeframe Inducement (IDM).
    • A confirmed shift in momentum showing buyers stepping in.

    Entering on confirmed lower-timeframe logic ensures that risk parameters are tightly defined, stop-loss distances are reduced, and entry occurs with empirical market confirmation rather than guesswork.

    4. Institutional Confluence & Macro Risk Protocols

    • Derivatives Alignment: CME Group options positioning confirms a strong bullish baseline, with significant Put Open Interest and positive dealer hedging buffers concentrated beneath current spot levels.
    • Macro Event Caveat: Market direction can change rapidly upon high-impact macroeconomic data. Major economic releases (such as Central Bank rate decisions, Non-Farm Payrolls, and CPI reports) carry the power to invalidate technical structures instantaneously.
    • Stop-Loss Discipline: Always define your invalidation point before entering any position. A hard stop-loss is mandatory to protect capital against sudden volatility spikes. Only execute trades when your technical setup, lower-timeframe confirmation, and economic calendar conditions fully align.

    SMC Trading Strategy & Execution Matrix

    The following operational framework outlines the step-by-step criteria required for trade validation and execution:

    Step / PhaseTimeframeTechnical Trigger & ConditionStrategic Purpose & Execution Action
    Phase 1: Macro TrendWeekly (1W)Ascending Trendline & Higher Highs/LowsConfirms prevailing bullish trend; establishes long-only trading bias.
    Phase 2: Liquidity IdentificationWeekly (1W)Inducement (IDM) Sweep + 3 Order BlocksIdentifies structural fuel; marks high-interest demand zones for price mitigation.
    Phase 3: Zone MitigationWeekly (1W)Price taps Weekly Order Block (Demand Zone)Do not enter blindly. Switch immediately to 1H and 15M execution charts.
    Phase 4: Lower-Timeframe Shift1-Hour (1H)Change of Character (CHoCH) / Break of StructureValidates that institutional buyers are defending the higher-timeframe zone.
    Phase 5: Execution Trigger15-Minute (15M)Sweep of 15M Inducement (IDM) into 15M OBEnter long trade on confirmation. Place hard Stop Loss below the structural low.
    Phase 6: Macro Risk CheckMacro / NewsHigh-impact events (NFP, CPI, Central Bank rates)Close or de-risk positions before major volatility events; respect invalidation.

    Conclusion

    EUR/USD presents an exceptionally clean technical and quantitative alignment. Higher-timeframe market structure remains structurally bullish, smart money inducement mechanics indicate an impending push toward new highs, and institutional derivatives data from the CME Group confirms a solid defense wall between 1.1425 and 1.1375.

    By combining weekly demand zones with disciplined 1-Hour and 15-Minute lower-timeframe execution, traders can avoid premature entries and trade in harmony with smart money order flow. Maintain strict stop-loss discipline, respect incoming macroeconomic catalysts, and let systematic confirmation guide your trading decisions.
  • Bitcoin Macro Outlook: Weekly SMC Analysis & CME Options Confluence for Key Institutional Levels

    Legal & Trademark Notice

    • Trademark Acknowledgment:CME®, Chicago Mercantile Exchange®, and QuikStrike® are registered trademarks of Chicago Mercantile Exchange Inc. and its licensors. All rights reserved.
    • Non-Affiliation & Fair Use:This publication is an independent market commentary and educational analysis conducted under Fair Use doctrines (17 U.S. Code § 107). This content is neither sponsored, authorized, nor endorsed by CME Group Inc.
    • Risk & Financial Disclaimer:Trading cryptocurrencies, futures, and options involves substantial financial risk and is not suitable for every investor. The analysis presented here represents personal research and educational opinion; it does not constitute financial advice, investment recommendations, or an offer to buy or sell any assets. Always conduct your own due diligence and consult a certified financial advisor before risking capital.

    1. Introduction

    Navigating Bitcoin’s broader market trends requires an analytical framework that connects price action with institutional positioning. While retail traders frequently rely on lagging technical indicators, institutional participants—including proprietary trading firms, asset managers, and liquidity providers—execute their risk management and positioning through regulated derivatives venues like the Chicago Mercantile Exchange (CME).

    By integrating higher-timeframe Smart Money Concepts (SMC)—such as structural Inducements (IDM) and unmitigated Order Blocks (OB)—with institutional CME QuikStrike options data (Open Interest distribution, Greeks, and volatility modeling), traders can establish a systematic, high-probability market perspective. This article breaks down the current confluence between weekly price structure and institutional order flow.

    2. Technical Analysis of CME Options Data

    An evaluation of the CME Bitcoin options landscape reveals distinct institutional footprints:

    A. Put/Call Ratio (PCR = 1.13)

    • Total Put Open Interest: 619 contracts
    • Total Call Open Interest: 549 contracts
    • Market Bias: A Put/Call Open Interest ratio of 1.13 highlights that put positions outnumber call positions across the exchange. In institutional derivatives, an elevated put ratio near key horizontal demand zones typically signifies institutional put writing (cash-secured put accumulation) and structured hedging, establishing a robust downside price cushion.

    B. Open Interest & Expiration Distribution

    • Underlying Reference: The benchmark CME Bitcoin futures settlement price is established around $64,705.
    • Front-Month Contract (30-Oct-26 / BTCV0): Represents the highest immediate liquidity concentration (~350 Calls vs. ~260 Puts), anchoring immediate frontline defense between $64,000 and $65,000.
    • Second-Month (27-Nov-26 / BTCX0) & Quarterly (24-Dec-26 / BTCZ0): Put open interest substantially outpaces call open interest, anchored heavily at the $60,000 round strike (~75–80 contracts) and distributed across the $50,000 – $58,000 macro baseline.

    C. The Greeks Profile (Delta, Gamma, Vega, Theta)

    • Delta (Directional Sensitivity): Delta-adjusted matrices confirm active market maker delta hedging at $62,500–$64,000, with positive delta absorption building across the $58,000–$60,000 baseline.
    • Gamma (Volatility Dampening): Prominent positive gamma clusters at $63,000 and $60,000 require option market makers to buy underlying futures on downward price dips to remain delta-neutral, creating an automatic volatility cushion.
    • Vega (Implied Volatility Exposure): In the expanded 50-strike window, fresh institutional vega is heavily concentrated at $74,500 – $75,500 (+31,140 Vega), marking a primary upside volatility target and institutional hurdle.
    • Theta (Time Decay Accumulation): Option writers have localized short-theta positioning around the $74,000–$75,500 zone (-171 to -400 Theta), representing levels where institutional sellers aim to capitalize on premium decay.

    D. Vol2Vol™ Expected Range & Churn Metrics

    • 1-Standard Deviation (1σ): On the weekly P16V6 (5.57 DTE) contract, the 1σ downside boundary lands precisely at $63,000 (aligned with the 25-Delta put marker).
    • Churn Ratio: The Churn metric at $63,000 stands at 1.0 (100%), verifying that 100% of the traded put volume was absorbed as persistent, sticky open interest rather than intraday day-trading turnover.
    • 2-Standard Deviation (2σ): Terminates at $60,000 (representing a 95% statistical probability boundary).
    • 3-Standard Deviation (3σ): Anchors across $57,500 – $58,000 (99.7% tail-risk confidence boundary).

    3. Top 3 Institutional Support & Resistance Levels

    Combining CME QuikStrike derivatives data with our independent weekly technical structure establishes three definitive market zones:

    Support Level 1: $63,000 – $64,000 (Immediate Frontline Buffer / 1σ Boundary)

    • Data Confluence: Positioned directly beneath the current futures benchmark ($64,705). This level represents the 1-Standard Deviation expected move on short-dated contracts, backed by a 100% Churn rate at $63,000 and dynamic gamma cushioning.
    • Technical Role: Serves as an initial short-term buffer. While minor intraday pullbacks can bounce here, higher-timeframe momentum may sweep this level to collect resting liquidity.

    Support Level 2: $60,000 (Major Structural Support / The Mega Put Wall & Weekly OB)

    • Data Confluence: This is the most critical support level on the entire board. In the CME strike profile, $60,000 hosts the single largest Put Open Interest tower (~75 to 80 contracts across expirations) and marks the 2-Standard Deviation (2σ) statistical boundary under the Vol2Vol™ model (95% confidence).
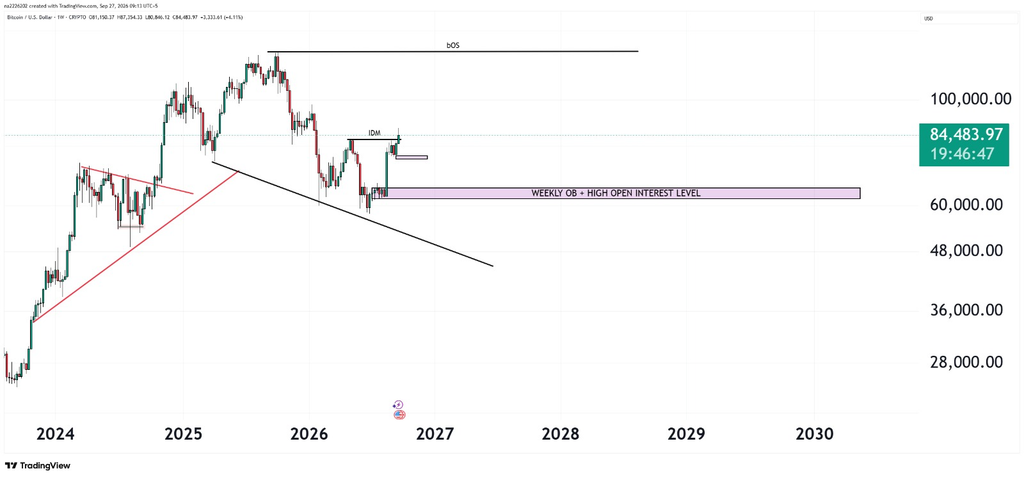
    • Technical Role: Our technical analysis identifies this area as aligning directly with the unmitigated weekly Order Block (OB), making it a primary institutional confluence zone for a high-probability bullish reversal.

    Support Level 3: $50,000 – $58,000 (Deep Macro Institutional Floor / 3σ Tail-Risk Base)

    • Data Confluence: Supported by heavy put positioning in November and December quarterly contracts (BTCX0 and BTCZ0), with immediate clusters at $58,000 and an isolated long-term institutional volume spike at $50,000 (~45 contracts).
    • Technical Role: Corresponds to the 3-Standard Deviation (3σ) tail-risk boundary (99.7% statistical safety net), serving as the ultimate macro accumulation floor in the event of an extended market correction.

    4. Data Summary Table

    Level ClassificationPrice ZoneRelevant CME Options DataTechnical / Model ConfluenceInstitutional Market Role
    Immediate Support (1σ)$63,000 – $64,000Front-Month Put Cluster, 100% Churn Rate1σ Standard Deviation, 25-Delta Put, Gamma BufferInitial downside buffer; absorbs minor intraday retracements
    Major Support (2σ)$60,000Mega Put Wall (75–80 OI), Nov/Dec Put Anchor2σ Standard Deviation (95% Boundary), Weekly Order BlockPrimary structural support; major institutional accumulation floor
    Macro Floor (3σ)$50,000 – $58,000Quarterly BTCZ0 Puts, $50k Strike Spike (~45 OI)3σ Tail-Risk Boundary (99.7%), Deep Vega BaseUltimate macro safety net against systemic market liquidations
    Key Resistance 1$68,000 – $70,000Front-Month Call Inflow, Upper Strike BaseBreakout Retest Level, Near-term Call WallInitial liquidity pool and first take-profit milestone
    Key Resistance 2$74,500 – $75,500Fresh Vega Inflow (+31,140), Heavy Short ThetaIntermediate Structural Volatility WallMajor institutional supply and options pinning target
    Macro Resistance 3$80,000 – $82,000Peak Call OI Strikes, Massive Dollar Vega NodesUpper Distribution Ceiling, Significant SupplyPrimary long-term target and institutional expansion cap

    5. My Technical Outlook & Trading Strategy

    When analyzing Bitcoin’s macro price action, the weekly timeframe remains our most reliable perspective. Currently, Bitcoin is demonstrating a robust and powerful uptrend across all timeframes. However, markets do not move in straight lines; for the price behavior to normalize and sustain its long-term growth, a healthy bearish correction is necessary.

    The Technical Catalyst: Weekly IDM Break

    Looking closely at the weekly chart, Bitcoin has recently taken out the Inducement (IDM) level. From a technical standpoint, this structural shift significantly increases the probability of a short-term bearish pullback. The market needs to retrace to collect trapped liquidity before it can fuel the next major leg up.

    The Target: Weekly Order Block and CME Confluence

    The logical target for this anticipated bearish drop is the unmitigated weekly Order Block (OB). What makes this specific support zone exceptionally strong is its alignment with key CME (Chicago Mercantile Exchange) data points. The confluence of a weekly Order Block with CME levels creates a massive zone of interest. Once the price taps into this precise area, the probability of a strong bullish reversal is extremely high.

    A Warning for Traders: Respect the Higher Timeframe

    To capitalize on this upcoming move, patience is absolutely critical. Traders must wait for the price to drop into this weekly macro level before executing trades.

    It is important to remember that because this IDM break occurred on the weekly timeframe, the resulting downward momentum will be dominant. During this drop, the market will likely ignore and slice through minor Order Blocks on lower timeframes. Relying on smaller timeframes right now could trap you in premature trades.

    The Bottom Line

    Do not rush the market. Wait patiently for Bitcoin to reach the weekly Order Block confluence zone. Letting the price come to this premium area will offer you a high-probability, low-risk trading opportunity with excellent reward potential.

    6. Frequently Asked Questions (FAQ)

    What makes the $60,000 level a “Mega Put Wall”?

    In options markets, a “Put Wall” refers to the strike price with the highest concentration of open put contracts. At $60,000, institutional participants have accumulated between 75 and 80 contracts across maturities. Option sellers defend this level through dynamic delta hedging, making it a powerful barrier against sustained downside continuation.

    How does a weekly Inducement (IDM) break affect lower-timeframe setups?

    An Inducement break on a macro timeframe signals that the market is seeking liquidity deeper in the range. Lower-timeframe (15-minute or 1-hour) demand zones often fail during higher-timeframe corrective legs because macro momentum overrides minor order flow. Traders are advised to prioritize higher-timeframe Order Blocks for trade execution.

    Why is the Put/Call Ratio of 1.13 considered constructive?

    While high put volume can reflect retail hedging, an open interest Put/Call Ratio above 1.0 in institutional environments often indicates that market makers have written substantial downside puts. This creates a positive gamma floor, meaning institutions actively support price on dips.

    7. Conclusion

    A disciplined trading approach demands the alignment of higher-timeframe market structure with verifiable institutional derivatives data. As highlighted by the CME QuikStrike options landscape, Bitcoin benefits from layered institutional defense: an immediate volatility boundary at $63,000, a major structural foundation at the $60,000 Mega Put Wall, and an ultimate macro floor across $50,000 – $58,000.

    With the weekly Inducement (IDM) broken, patience remains paramount. Awaiting a measured retracement into the confluence of the unmitigated weekly Order Block and the CME $60,000 support zone provides a disciplined, data-backed setup to capitalize on Bitcoin’s next major macro expansion.

  • Mastering Gold (GC) Trading: Combining CME Options Data with Technical Analysis

    Important Note (Disclaimer & Attribution): This article is written solely for educational and informational purposes. All options data, references, and analytics used in this article are sourced from the CME Group QuikStrike Options Tool. We are utilizing CME Group’s data under ‘Fair Use’ strictly for market analysis and technical study, and this does not constitute any claim of ownership over the data. This article is not financial advice, an investment tip, or a recommendation to buy/sell. Trading involves a high risk of substantial financial loss; therefore, always conduct your own research and consult with your financial advisor before executing any real trades.

    The Gold (GC) futures market is currently standing at a highly critical, options-driven technical juncture. To understand the positioning of smart money and institutional traders, an in-depth analysis of options data is essential. By utilizing the official CME Group QuikStrike tool to analyze various heatmaps, volume profiles, and Greek matrices (Delta, Gamma, Theta, Vega), we can clearly observe the positioning of major players (market makers and put sellers).

    When we observe heavy Open Interest (OI) and volume on the put side, it is a clear indication that institutions are deploying massive capital at those levels to prevent the market from falling. Below is a detailed analysis of market dynamics and the three strongest support points based on this data.

    Technical Analysis of CME Options Analytics Tools

    To understand the true market trend, it is crucial to look at three key metrics from the CME Group:

    • Open Interest Profile and EOD Volume: Open Interest and Volume charts are the most significant visual evidence of actual market liquidity. In the EOD Volume and Vol2Vol Expected Range charts, long yellow bars (spikes) on the put side prove that aggressive put selling is occurring in the market to cover downside risk. Option writers are collecting premiums and have full confidence that the market will continue to trade above these levels.
    • Options Open Interest Heatmaps: Heatmaps are the best way to track fresh cash flow in the market. Teal (positive changes) and Dark Red (negative changes) highlights make it clear that option sellers are not just holding old positions; they are continuously adding new contracts across short-term (0 DTE) to medium-term (59 DTE) expirations. The accumulation of new volume at specific strikes in this manner is known as strong “Support Building.”
    • The Greeks Protocol (Delta, Gamma, Vega, Theta): Professional institutional trading runs on Greeks, not just volume. On the put side, dark red/negative Delta shows that the sellers’ directional bias is strongly bullish. Positive Gamma blocks with teal highlights mean that if the market falls, options market makers will be forced to buy gold to hedge their positions, which will compel the market to bounce. Furthermore, to profit from Theta decay, sellers do not allow these support floors to break.

    The 3 Strongest Support Points for Gold (GC) (Where the Market Can Bounce Upward)

    After cross-verifying all CME data points, matrices, and volume profiles, the following three critical and robust support levels emerge for the market, from which a strong bullish bounce can be expected:

    1. 4300 Strike (The Ultimate Institutional Floor) This level is the biggest fortress in the market and is currently acting as the most important pivot point.

    • Why It Is Important: Massive activity is present at the 4300 strike in the CME Group’s Gamma, Vega, and Theta matrices. Specifically, in the Vega x OI matrix, a value of over 2.5 million has been recorded at this strike, showing that the highest volatility risk is being traded at this exact level.
    • Market Impact: Institutional sellers have deployed their largest capital at this level. If the price tests 4300, option sellers will defend this level through delta hedging and aggressive buying. This is the primary base of the market from where the biggest reversal is expected.

    2. 4250 Strike (Strong Structural & Medium-Term Support) This is the second strongest structural level that has consistently appeared strong in both near-term and longer-term expirations.

    • Why It Is Important: According to CME data, consistent strong blocks (highlights) have been observed in OI x Delta and OI x Gamma at this strike. Fresh put writing has also been noted at 4250 in the EOD Volume and OI Change matrices.
    • Market Impact: This level acts as a robust secondary defense. If the psychological level of 4300 breaks due to an extreme news event, 4250 is the final solid point where smart money will regain control of the market and trigger a price bounce.

    3. 4200 Strike (Active Immediate/Short-Term Defense) For short-term and swing traders, this is a highly active and immediate floor.

    • Why It Is Important: According to the Vol2Vol Expected Range and Open Interest Profile charts, the largest put volume spikes below the current price are located at 4200. In the Theta x OI matrix, heavy negative values have been added at this level for short-term expirations (such as 9 DTE).
    • Market Impact: This directly means that short-term speculators are trading this level as an immediate support. In the event of any minor correction, panic, or intra-week dip in the market, the 4200 level will prove to be the first solid barrier from which the market can secure a quick intraday bounce.

    CME Data Support Matrix Summary

    The table below provides a summary of the 3 key support levels based on the CME Group data:

    Support Level (Strike)Support TypeKey Protocol Evidence (CME Data Base)Market Action / Expectation
    4300 StrikeUltimate / Primary FloorHighest Vega x OI, Massive Gamma blocks, Peak Theta decay concentration (31-59 DTE expirations).Heavy buying expected from market makers. Strongest bounce-back area.
    4250 StrikeStructural Secondary BaseStrong Delta x OI negative exposure, consistent fresh volume in medium-term options.If 4300 breaks, this level will prevent the market from collapsing.
    4200 StrikeImmediate Short-Term FloorHighest Put bar in Vol2Vol Profile, aggressive Theta accumulation in near-term (9 DTE).Will absorb minor dips. Excellent entry point for short-term bounces.

    My Technical Outlook & Trading Strategy (H4 Timeframe)

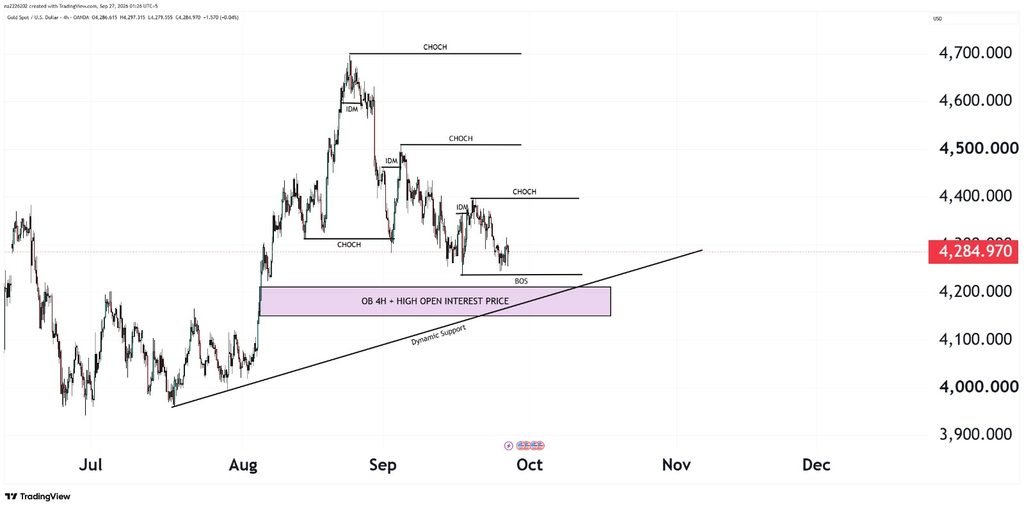
    Looking at the 4-Hour (H4) timeframe for Gold’s technical analysis, the market is currently moving in a downtrend (bearish structure). If the price breaks its current lower-low and creates a new BOS (Break of Structure), the downtrend will visibly continue.
    ​However, a crucial Point of Interest (POI) awaits in the path of this downward movement. Right where the market is expected to drop, there is a highly solid H4 Bullish Order Block. Most notably, this Order Block aligns perfectly with the 4200 price level—the exact level we identified in the CME Group options data as a massive “Institutional Support.”
    ​Furthermore, a major Trendline intersects precisely with this order block and the 4200 support level. These three elements combined (H4 Order Block + Trendline Support + CME Options Put Data) transform this area into a “High-Probability Triple Confluence Zone.”

    ​My Trading Strategy:

    When the market presents a double or triple confirmation like this, the probability of a trend reversal is at its absolute highest. As soon as the price taps into this 4200 order block zone, I will scale down to lower timeframes (such as 15m or 1H) and wait for a clear market structure shift or CHoCH (Change of Character). If strong buyer momentum is validated at this heavy support zone, it will present an excellent, high Risk-to-Reward (RR) long (buy) trade opportunity.

    Conclusion The institutional analysis of QuikStrike options data clearly indicates that smart money is not currently bearish on Gold (GC). They have erected a strong wall of Put Selling (support) in the 4200 to 4300 range. As long as these 3 crucial support levels hold, the overall market trend will remain “Buy on Dips,” and there are strong chances of the market gaining powerful upward momentum from these points.