Important Note (Disclaimer & Attribution): This article is written solely for educational and informational purposes. All options data, references, and analytics used in this article are sourced from the CME Group QuikStrike Options Tool. We are utilizing CME Group’s data under ‘Fair Use’ strictly for market analysis and technical study, and this does not constitute any claim of ownership over the data. This article is not financial advice, an investment tip, or a recommendation to buy/sell. Trading involves a high risk of substantial financial loss; therefore, always conduct your own research and consult with your financial advisor before executing any real trades.
The Gold (GC) futures market is currently standing at a highly critical, options-driven technical juncture. To understand the positioning of smart money and institutional traders, an in-depth analysis of options data is essential. By utilizing the official CME Group QuikStrike tool to analyze various heatmaps, volume profiles, and Greek matrices (Delta, Gamma, Theta, Vega), we can clearly observe the positioning of major players (market makers and put sellers).
When we observe heavy Open Interest (OI) and volume on the put side, it is a clear indication that institutions are deploying massive capital at those levels to prevent the market from falling. Below is a detailed analysis of market dynamics and the three strongest support points based on this data.
Technical Analysis of CME Options Analytics Tools
To understand the true market trend, it is crucial to look at three key metrics from the CME Group:
- Open Interest Profile and EOD Volume: Open Interest and Volume charts are the most significant visual evidence of actual market liquidity. In the EOD Volume and Vol2Vol Expected Range charts, long yellow bars (spikes) on the put side prove that aggressive put selling is occurring in the market to cover downside risk. Option writers are collecting premiums and have full confidence that the market will continue to trade above these levels.
- Options Open Interest Heatmaps: Heatmaps are the best way to track fresh cash flow in the market. Teal (positive changes) and Dark Red (negative changes) highlights make it clear that option sellers are not just holding old positions; they are continuously adding new contracts across short-term (0 DTE) to medium-term (59 DTE) expirations. The accumulation of new volume at specific strikes in this manner is known as strong “Support Building.”
- The Greeks Protocol (Delta, Gamma, Vega, Theta): Professional institutional trading runs on Greeks, not just volume. On the put side, dark red/negative Delta shows that the sellers’ directional bias is strongly bullish. Positive Gamma blocks with teal highlights mean that if the market falls, options market makers will be forced to buy gold to hedge their positions, which will compel the market to bounce. Furthermore, to profit from Theta decay, sellers do not allow these support floors to break.
The 3 Strongest Support Points for Gold (GC) (Where the Market Can Bounce Upward)
After cross-verifying all CME data points, matrices, and volume profiles, the following three critical and robust support levels emerge for the market, from which a strong bullish bounce can be expected:
1. 4300 Strike (The Ultimate Institutional Floor) This level is the biggest fortress in the market and is currently acting as the most important pivot point.
- Why It Is Important: Massive activity is present at the 4300 strike in the CME Group’s Gamma, Vega, and Theta matrices. Specifically, in the Vega x OI matrix, a value of over 2.5 million has been recorded at this strike, showing that the highest volatility risk is being traded at this exact level.
- Market Impact: Institutional sellers have deployed their largest capital at this level. If the price tests 4300, option sellers will defend this level through delta hedging and aggressive buying. This is the primary base of the market from where the biggest reversal is expected.
2. 4250 Strike (Strong Structural & Medium-Term Support) This is the second strongest structural level that has consistently appeared strong in both near-term and longer-term expirations.
- Why It Is Important: According to CME data, consistent strong blocks (highlights) have been observed in OI x Delta and OI x Gamma at this strike. Fresh put writing has also been noted at 4250 in the EOD Volume and OI Change matrices.
- Market Impact: This level acts as a robust secondary defense. If the psychological level of 4300 breaks due to an extreme news event, 4250 is the final solid point where smart money will regain control of the market and trigger a price bounce.
3. 4200 Strike (Active Immediate/Short-Term Defense) For short-term and swing traders, this is a highly active and immediate floor.
- Why It Is Important: According to the Vol2Vol Expected Range and Open Interest Profile charts, the largest put volume spikes below the current price are located at 4200. In the Theta x OI matrix, heavy negative values have been added at this level for short-term expirations (such as 9 DTE).
- Market Impact: This directly means that short-term speculators are trading this level as an immediate support. In the event of any minor correction, panic, or intra-week dip in the market, the 4200 level will prove to be the first solid barrier from which the market can secure a quick intraday bounce.
CME Data Support Matrix Summary
The table below provides a summary of the 3 key support levels based on the CME Group data:
| Support Level (Strike) | Support Type | Key Protocol Evidence (CME Data Base) | Market Action / Expectation |
|---|---|---|---|
| 4300 Strike | Ultimate / Primary Floor | Highest Vega x OI, Massive Gamma blocks, Peak Theta decay concentration (31-59 DTE expirations). | Heavy buying expected from market makers. Strongest bounce-back area. |
| 4250 Strike | Structural Secondary Base | Strong Delta x OI negative exposure, consistent fresh volume in medium-term options. | If 4300 breaks, this level will prevent the market from collapsing. |
| 4200 Strike | Immediate Short-Term Floor | Highest Put bar in Vol2Vol Profile, aggressive Theta accumulation in near-term (9 DTE). | Will absorb minor dips. Excellent entry point for short-term bounces. |
My Technical Outlook & Trading Strategy (H4 Timeframe)
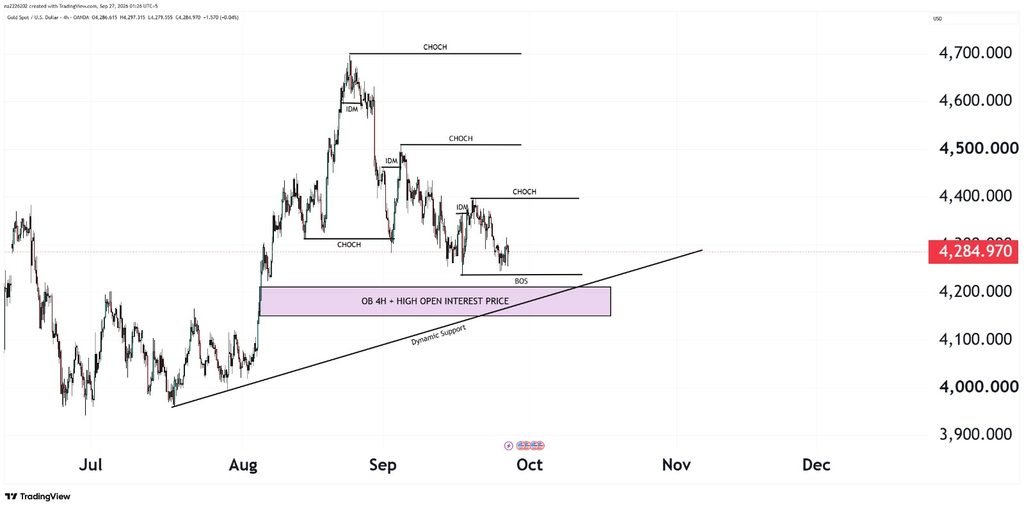
Looking at the 4-Hour (H4) timeframe for Gold’s technical analysis, the market is currently moving in a downtrend (bearish structure). If the price breaks its current lower-low and creates a new BOS (Break of Structure), the downtrend will visibly continue.
However, a crucial Point of Interest (POI) awaits in the path of this downward movement. Right where the market is expected to drop, there is a highly solid H4 Bullish Order Block. Most notably, this Order Block aligns perfectly with the 4200 price level—the exact level we identified in the CME Group options data as a massive “Institutional Support.”
Furthermore, a major Trendline intersects precisely with this order block and the 4200 support level. These three elements combined (H4 Order Block + Trendline Support + CME Options Put Data) transform this area into a “High-Probability Triple Confluence Zone.”
My Trading Strategy:
When the market presents a double or triple confirmation like this, the probability of a trend reversal is at its absolute highest. As soon as the price taps into this 4200 order block zone, I will scale down to lower timeframes (such as 15m or 1H) and wait for a clear market structure shift or CHoCH (Change of Character). If strong buyer momentum is validated at this heavy support zone, it will present an excellent, high Risk-to-Reward (RR) long (buy) trade opportunity.
Conclusion The institutional analysis of QuikStrike options data clearly indicates that smart money is not currently bearish on Gold (GC). They have erected a strong wall of Put Selling (support) in the 4200 to 4300 range. As long as these 3 crucial support levels hold, the overall market trend will remain “Buy on Dips,” and there are strong chances of the market gaining powerful upward momentum from these points.
Leave a Reply