
Disclaimer:
Regulatory Disclosure, Data Attribution & Fair Use Notice:
All exchange-traded options metrics, volume profiles, open interest matrices, and volatility figures referenced throughout this educational publication are sourced directly from the CME Group QuikStrike® Tool (https://www.cmegroup.com). “CME Group”, “CME”, and “QuikStrike” are registered trademarks of Chicago Mercantile Exchange Inc. This content is prepared and published strictly under the Fair Use doctrine for non-commercial educational, analytical, and public commentary purposes.
Not Financial Advice: The insights and strategies shared herein represent personal technical commentary and do not constitute financial, investment, or trading advice. Trading foreign currencies, options, and futures involves a high risk of capital loss and is not appropriate for all investors.
Introduction
Navigating currency markets successfully requires an understanding of how major institutional market participants deploy capital. While retail traders often rely solely on single-timeframe price charts, institutional desks combine macro order flow with underlying derivatives data. For the Canadian Dollar (CAD / CME: 6C Futures), a powerful convergence is unfolding between Smart Money Concepts (SMC) price action and public derivatives metrics reported by the CME Group QuikStrike® Tool.
Derivatives positioning—specifically Open Interest, Volume Distribution, and Option Greeks (Delta, Gamma, Vega, and Theta)—reflects the actual monetary commitments and hedging obligations of commercial hedgers and liquidity providers. By cross-referencing this institutional data with 4-Hour (4H) SMC market structure, traders can pinpoint high-probability reaction levels with precision. This report outlines the institutional support landscape for the Canadian Dollar, identifies the top three verified support floors, and presents a disciplined, multi-timeframe trading strategy.
Technical Analysis of Options Data
An objective evaluation of current Canadian Dollar options data extracted from the CME Group QuikStrike® Tool highlights several critical institutional footprints:
- Total Open Interest (Put Wall Concentration):
Data from the CME Group QuikStrike Open Interest Matrix reveals a massive concentration of put open interest anchored at the 0.7000 strike in the active quarterly cycle, totaling 5,011 Put contracts. This represents the single largest defensive barrier (Put Wall) across the entire expiration cycle, signaling that institutional desks have built extensive downside protection here. - End-of-Day (EOD) Volume Structure:
According to recent CME Group EOD Volume Matrices, active daily execution was concentrated between 0.7030 and 0.7100. Notably, between 0.7030 and 0.7040, market participants executed 33 to 50 contracts, while volume below 0.7030 dropped to near zero. This distinct volume shelf demonstrates that institutional market makers actively defended this lower boundary during the session. - Delta-Adjusted Open Interest (OI × Delta):
Factoring options delta into open interest via the CME QuikStrike Delta Matrix shows that the 0.7000 strike commands an extraordinary -3,749 Delta exposure. Because market makers who are short these puts must buy underlying futures or spot contracts as price nears this strike to remain delta-neutral, this level acts as an automated institutional buying cushion. - Gamma & Theta Cluster (Volatility Dampener):
Short-term expirations (2 to 4 DTE) reveal over 10,000 combined Gamma points and heavy negative theta decay centered around 0.7080. Positive gamma obligates market makers to buy dips and sell rallies, dampening volatility and supporting market stability. - Macro Vega Exposure:
The 0.7000 strike controls 484 Vega in the 65 DTE cycle, demonstrating that commercial hedgers and institutional funds have established their long-term macro volatility cushions directly at this price.
Top 3 Support Points:
Synthesizing on-chart price action with CME Group QuikStrike® metrics confirms the following three primary support boundaries:
1. Support Level 1 (Immediate / Intraday Volume Shelf): 0.7030 – 0.7040
- Solid Reasoning & Data Confluence:
This level represents the lower boundary of active session trading on the CME EOD Volume Matrix, where trading activity abruptly dried up below 0.7030. Furthermore, on the CME Vol2Vol™ statistical model, 0.7040 aligns with the 3-Standard Deviation (-3 SD) daily volatility boundary, establishing this level as a high-probability springboard for intraday pullbacks.
2. Support Level 2 (Major Institutional Floor / Golden Put Wall): 0.7000
- Solid Reasoning & Data Confluence:
The 0.7000 handle is the premier structural support across the entire Canadian Dollar market structure. It houses 5,011 Put contracts, -3,749 Delta exposure, and 484 Vega on the CME QuikStrike platform. As a major psychological round number, it is heavily defended by market makers to hedge existing exposure.
3. Support Level 3 (Deep Structural / Extreme Demand POI): 0.6937 – 0.6848
- Solid Reasoning & Data Confluence:
In the event that high-impact macroeconomic events or global market shocks breach the 0.7000 floor, institutional order flow will target deep structural discount pricing. CME QuikStrike heatmaps display secondary out-of-the-money put clusters resting at 0.6900 (228 contracts) and 0.6850 (192 contracts), framing the boundaries of deep wholesale demand.
Data Summary Table:
| Support Tier | Target Price Zone | CME Group QuikStrike® Derivative Metric | Smart Money / Technical Function | Tactical Execution Stance |
| Tier 1 (Immediate) | 0.7030 – 0.7040 | CME Volume Cutoff + -3 SD Vol2Vol Boundary | Intraday Demand Shelf & Post-IDM Expansion Base | Day Trading / Scalp Longs on 5m FVG Confirmation |
| Tier 2 (Major Floor) | 0.7000 | 5,011 Put Wall + 3,749 Delta Wall + 484 Vega | Major Psychological Round Number & Hedging Wall | High-Conviction Swing Long on 15m/1H Reversal |
| Tier 3 (Extreme POI) | 0.6937 – 0.6848 | Tail-Risk Put Clusters (0.6900 & 0.6850 Strikes) | 4H Primary Order Block & 4H Extreme Order Block | Maximum Asymmetric R:R Position Building |
My Technical Outlook & Trading Strategy:
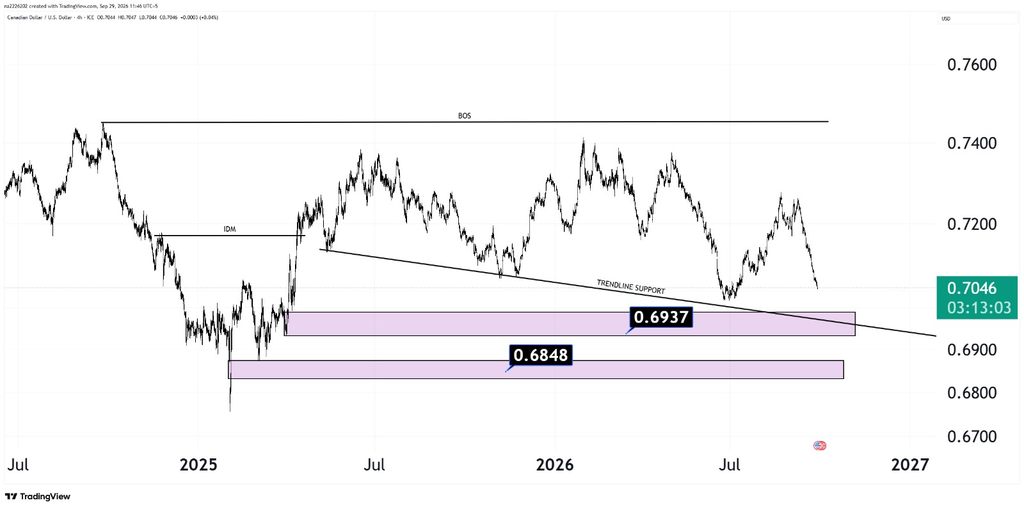
Market Context & Overall Trend
- Primary Timeframe: 4-Hour (4H)
- Current Trend: Uptrend (Bullish)
- Current Market Price (CMP): ~0.7046
Market Structure Analysis
The 4-Hour market structure for the Canadian Dollar remains decisively bullish. Price action confirms that the market has successfully swept the internal Inducement (IDM) level, clearing weak-handed retail stops and rebalancing local liquidity pools.
According to Smart Money Concepts (SMC), once an Inducement is swept within an established uptrend, the most probable market move is an expansion toward a Break of Structure (BOS) rather than an immediate Change of Character (CHOCH). Supported by the solid options floor observed in CME derivatives data, there is a high probability that the market will continue upward to complete a clean 4H BOS.
Key Zones of Interest (POI)
- Primary Support (Order Block 1) at
0.6937: Positioned just below the current price consolidation, there is a highly validated 4H Order Block converging with ascending trendline support. The market will find it difficult to break below this strong foundational level. - Extreme Support (Order Block 2) at
0.6848: In the event that elevated volatility or fundamental factors cause price to breach the primary 0.6937 zone, this 0.6848 extreme Order Block represents the origin of the macro impulse. It is the ultimate critical zone that institutional algorithms are expected to respect.
Multi-Timeframe Entry Strategy
To trade these zones with precision, avoid placing blind limit orders. Follow this disciplined three-step execution framework:
- Zone Testing (4H Timeframe): Allow price to retrace naturally and tap into validated institutional support (either the 0.7030 volume shelf, the 0.7000 Put Wall, or the deeper 0.6937 / 0.6848 Order Blocks).
- Inducement Confirmation (1H / 15m Timeframe): As soon as price enters your Point of Interest (POI), scale down to the 1-Hour or 15-Minute timeframe. Monitor structural development and wait for a fresh internal Inducement (IDM) to be engineered and swept.
- Entry Execution (5m Timeframe): Execute final entries on the 5-Minute (5m) timeframe. Once the 15m IDM is taken, look for a confirmed 5m Change of Character (CHOCH) or Fair Value Gap (FVG) mitigation to enter a high-probability long position.
Fundamental Analysis & Cross-Asset Correlation
- Key Event: Australian Economic Data Releases & Global Commodity Signals.
- Market Impact: Monitor the economic calendar closely. The Canadian Dollar and Australian Dollar share a high positive correlation as premier commodity currencies. Positive prints in Australian economic data (such as employment, retail sales, or trade balance) typically drive broad commodity appetite, providing direct fundamental momentum for CAD to expand upward off our identified support levels.